We gather three different flavours of data: Monitoring, Product Data, and Behavioral Data. Each perspective serves a distinct purpose but together provides a comprehensive understanding of your product and its performance.
1. Monitoring: Ensuring System Health
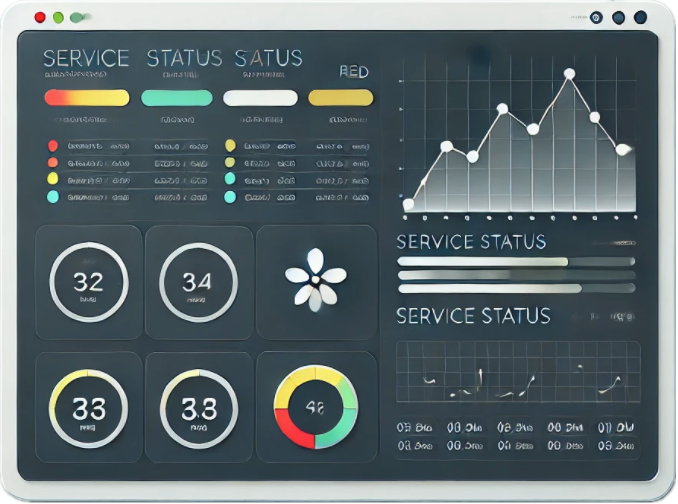
Monitoring provides real-time insights into the health and performance of your systems in production. For a product team, this is non-negotiable.
If your systems are down or unresponsive, it should never come as a surprise. Effective monitoring ensures that alarms are triggered well in advance, enabling teams to address issues proactively. Monitoring should cover not only system availability but also service behavior.
Key monitoring metrics might include:
– Is the system up and running?
– Are there error codes being logged?
– Is the system activity matching expectations?
– Are customers able to complete their tasks?
When an alarm goes off, it should become a top priority for the team to resolve. Monitoring is the foundation of reliable product delivery and customer satisfaction.

2. Product Data: Strategic and Tactical Insights
Product data provides an overview of how your product performs in the market, helping you make informed strategic and tactical decisions. This data supports the creation of KPIs, tracking targets, or following up on OKRs.
Examples of useful product data:
– Total number of active customers.
– Frequency of customer returns.
– Rate of new customer acquisition.
– Number of user actions within the product.
Breaking this data into subgroups (e.g., by demographics or region) can provide deeper insights. It is also valuable to visualize these metrics over time to identify trends and changes in customer behavior.
This layer enables teams to answer critical questions like: Are we attracting new users? Are customers staying engaged? What trends are emerging?

3. Behavioral Data: Understanding Customer Actions
Behavioral data goes a step further by revealing how customers interact with your product. This includes:
– Tracking whether customers perform the intended actions.
– Understanding where they drop off in a flow.
This data helps you evaluate whether your product is meeting customer needs and identify areas for improvement. When changes are made, behavioral data allows you to measure whether the adjustments achieved the desired results.
A combined approach—using both product and behavioral data—provides the most actionable insights. Many tools on the market integrate these data types seamlessly, making it easier to analyze and act on the findings.
A Real-World Example: Improving Conversion in an Online Checkout
At one point, I worked with a team focused on optimizing conversion rates in an online checkout flow. Our overall conversion KPI needed significant improvement, so we set a pretty aggressive target.
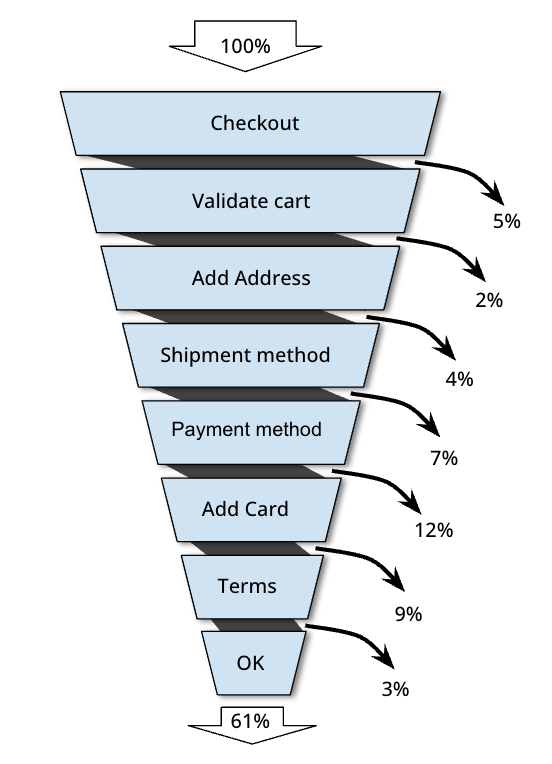
We broke down the checkout process into individual steps and began tracking user behavior at each stage. Behavioral data showed us exactly where customers were dropping off, giving us a clear view of the flow’s weak points.

To understand even more than what the numbers gave us we conducted user interviews to understand the challenges customers faced in the flow. Based on our findings, we developed hypotheses for improvements.
Each hypothesis followed this structure:
– We believe [this change/solution]
– Will lead to [this result/effect]
– And we’ll know it’s true when we see [this measurable outcome].
With a live customer base, we could quickly validate hypotheses through A/B testing. Solutions ranged from simple copy changes to removing unnecessary steps in the process. Over six months, we tested around 30–40 changes, keeping the effective ones and discarding the rest.
What mattered wasn’t individual solutions, it was achieving our target KPI. We were often surprised by what worked and we could really understand the value of experimentation.
We visualized the entire flow as a funnel, which helped us focus on improving specific steps. Each step was an opportunity to move more customers further into the flow, resulting in higher overall conversion.
Key Takeaways
– Use Monitoring to ensure systems are reliable and issues are detected early.
– Leverage Product Data to guide strategy and understand high-level trends over time.
– Analyze Behavioral Data to uncover how customers interact with your product and validate changes through experimentation.
By combining these data layers, you can systematically improve your product, optimize customer experiences, and achieve your business goals. Success lies in iterating, learning, and focusing on what truly drives results.


